.png)
Measuring the business impact of training has always been one of the toughest challenges in enablement. When it comes to industry learning, the challenge gets even harder. Sellers aren’t just absorbing product features or a new methodology—they’re learning to see the world through the customer’s lens.
Why does that matter? Because sellers who understand their client’s industry can connect the dots between their solution and the customer’s business outcomes. They stop talking about technology capabilities and start talking about business impact.
That shift helps them “get out of the IT room” and engage credibly with business executives—where real buying decisions happen. In fact, industry data shows that sellers who reach business stakeholders see up to 40% higher win rates and deal sizes than those who stay confined to IT.
The problem is, the impact of industry learning is hard to measure. Industry learning influences behavior in ways that don’t always show up immediately in CRM dashboards. It sits at the intersection of knowledge, confidence and relationship-building skills. But it can be measured—and when you do it right, you’ll not only prove the value of your training program but also unlock a clear roadmap for scaling business impact.
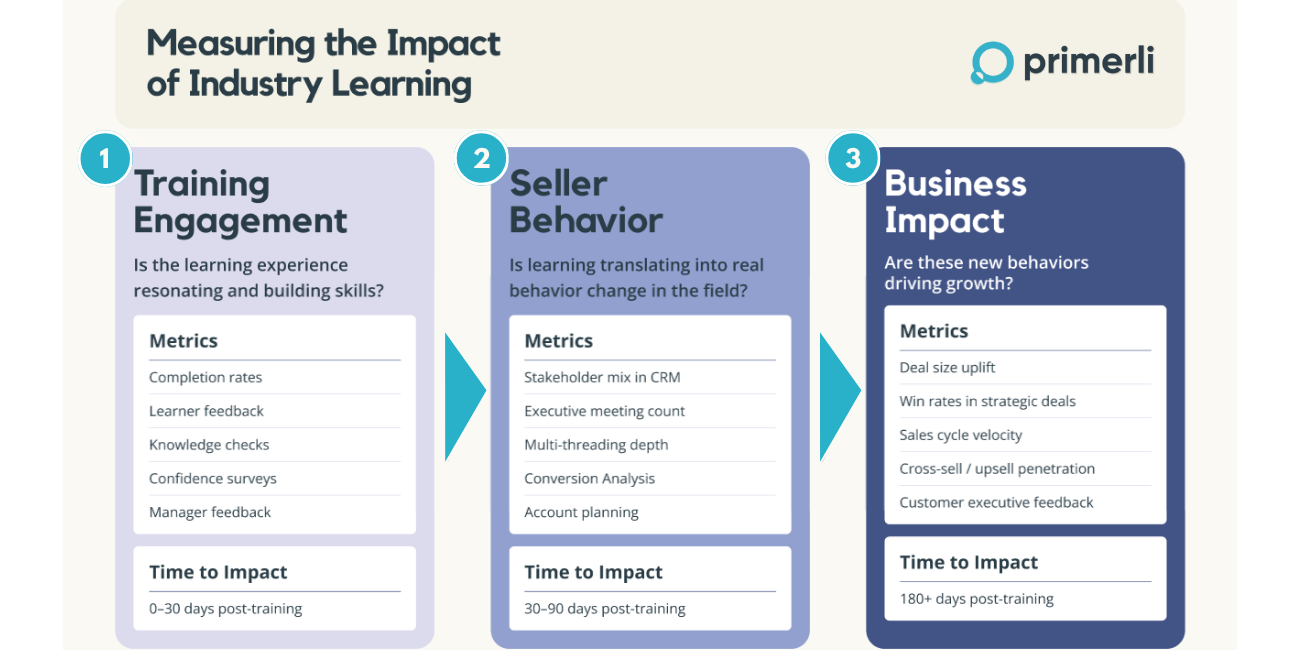
That’s why we’ve built a simple, three-part framework that connects the dots. This framework helps you capture what really matters: whether your teams are breaking out of the IT silo and having the strategic conversations that lead to bigger, more meaningful deals.
Step 1. Training Engagement (Leading Indicators)
The first question is whether sellers are actively engaging with the learning material—not just logging in, but completing and revisiting it. Next is whether they’re actually learning and retaining the key concepts that underpin effective conversations. Finally, confidence matters: are they becoming more comfortable in their client conversations?
These learning engagement metrics act as leading indicators. They show whether the learning experience is resonating, building capability, and setting the stage for behavior change.
Key metrics:

Example in practice:
A cybersecurity software company runs a financial services training program that includes scenario-based assessments. In these exercises, sellers have to map compliance requirements to business initiatives—distinguishing between an IT security audit and a board-level risk management strategy. Sellers who can make this distinction score 85% higher on business stakeholder engagement within 60 days.
Example dashboard:


What good looks like:
Aim for 70%+ completion rates and 70%+ pass rates on knowledge assessments. Lower thresholds here mean your metrics on the second step (Seller behavior) will suffer—sellers won't change behavior if they haven't truly internalized the content.
At Primerli, we typically see completion rates ranging from 70% to 95%, depending on the level of leadership support. While most corporate learning programs struggle to exceed 10% completion, we’ve found that pairing high-quality content with a thoughtful promotional strategy can lift engagement dramatically.
The diagnostic value:
If engagement is strong but later metrics flatline, you know the issue isn't motivation—it's that your content isn't translating to field-ready skills or isn't being reinforced by frontline managers.
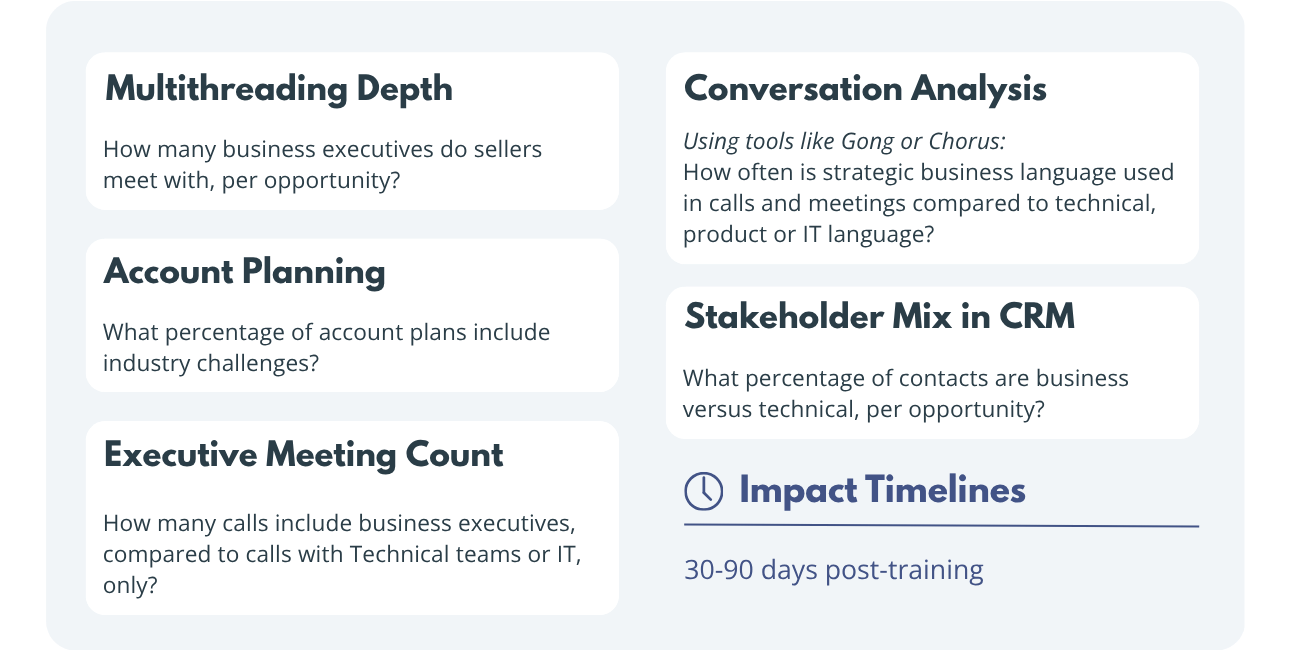
Step 2. Seller Behavior (Translational Indicators)
Learning only matters if it changes behavior. In this case, the behavior shift that matters most is whether sellers are engaging business stakeholders—not just IT.
Translational metrics measure that shift. They show how learning translates into real behavior change in the field—the bridge between course completion and business impact. Use a control group or historical data so you can compare trained vs. untrained (or pre-training) behavior.
These metrics reveal whether training is fulfilling its core purpose: enabling sellers to have credible business conversations beyond the IT department. And because they appear weeks before revenue impact shows up in your forecast, they give you an early warning system and the opportunity to course-correct in time.
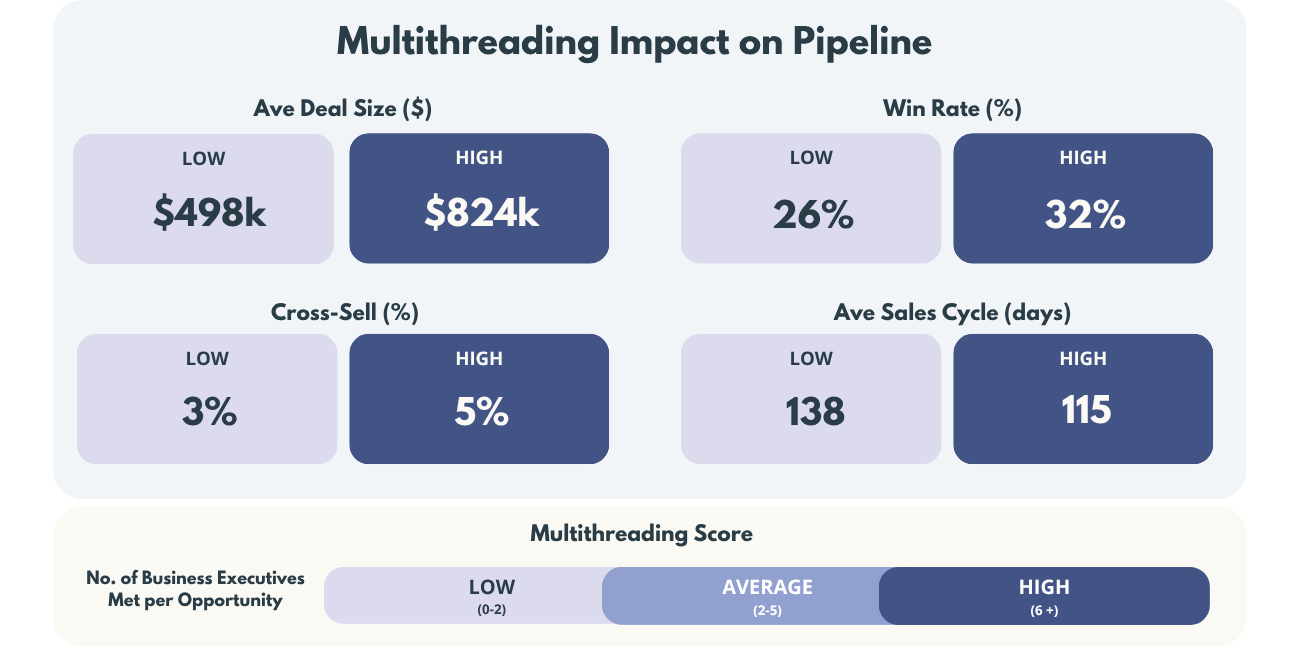
Selecting behavior metrics requires some forethought because they help define your metrics for step 3. In Step 3 you will segment deals by multithreading 'depth' to compare pipeline impact. “Depth” is best defined simply: label opportunities high, medium, or low depth based on one or two seller behaviors (for example, 0–2 business-executive meetings = low, >5 = high). These cohorts can then be compared to see how high, medium and low multithreading depth affects win rates, deal size, and deal velocity.
Key metrics:
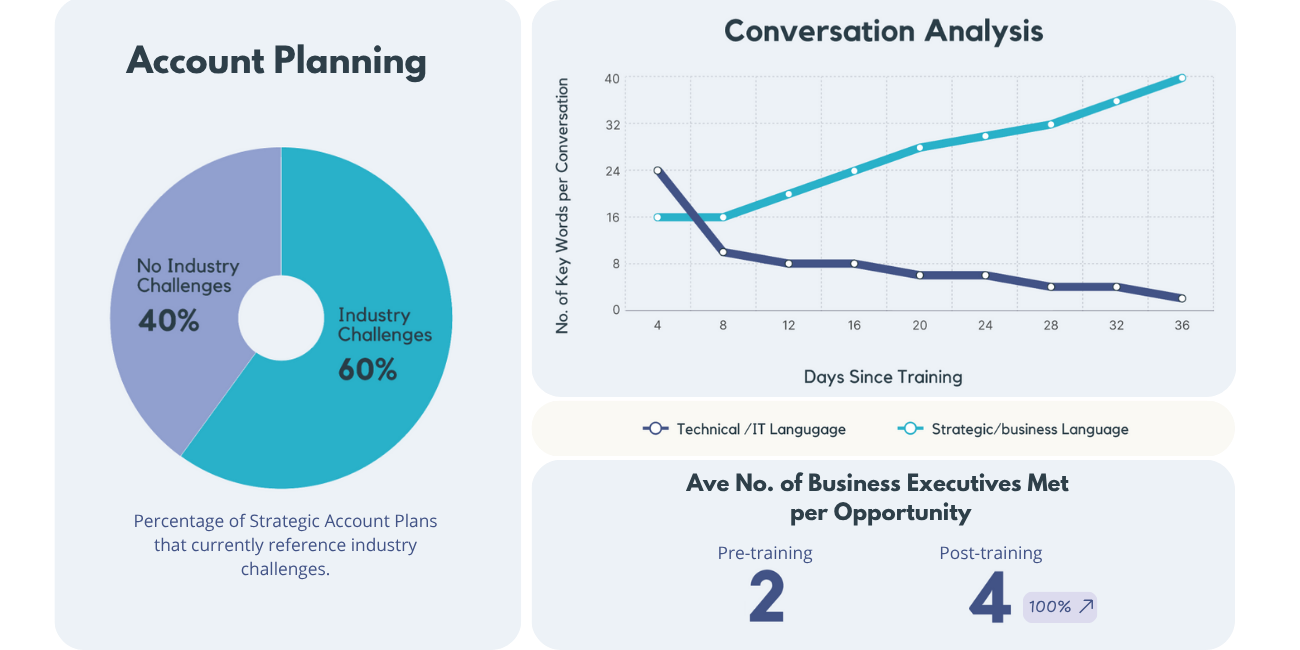
Example in practice:
An infrastructure software company trains sellers on manufacturing dynamics. Within 60 days, trained sellers engage 3.2 business stakeholders per opportunity versus 1.8 for their peers—and critically, those conversations center on production efficiency and supply chain resilience rather than server capacity and network architecture.
Example dashboard:
The diagnostic value:
If sellers complete training but behavior doesn't change, there are a few questions you need to ask. Are managers coaching to the new approach? Are sellers getting real-world practice opportunities? Is your CRM hygiene good enough to actually track stakeholder engagement? This tier tells you if the training is bridging into actual field execution.
Transitioning From Step 2 to Step 3:
In Step 3, you will assess how seller behaviour translates into business impact. To make this assessment, define a “multithreading” score and group opportunities into high, medium, and low multithreading (for example, fewer than 2 business-executive meetings = low, more than 5 = high). In Step 3, you’ll compare pipeline outcomes like win rates, deal size, and velocity across these cohorts to assess the impact of multithreading.

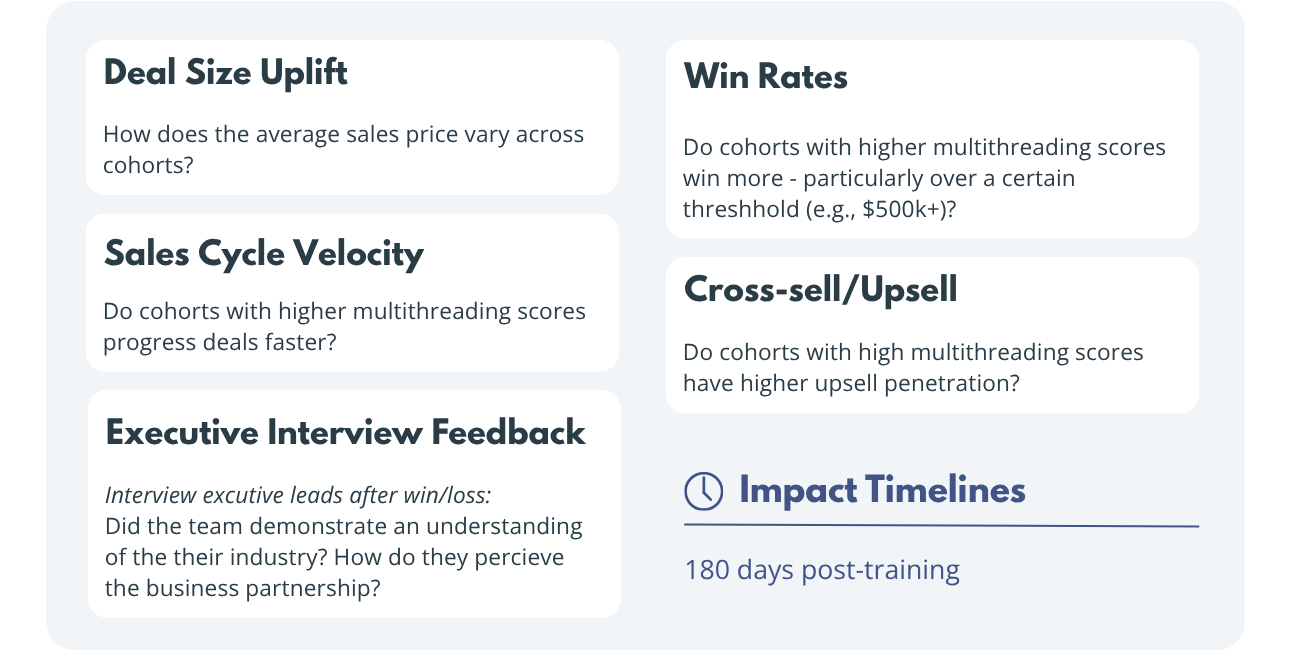
Step 3. Business Impact (Lagging Indicators)
At the end of the day, executives care about one thing—impact. Did the change in seller behavior actually translate into business results? Did industry learning lead to bigger, better deals?
Business impact metrics are lagging indicators. They validate that your program isn’t just creating activity—it’s driving revenue, pipeline growth, and improved deal quality. The key is to connect behavior change, not course completion, to measurable business outcomes.
By segmenting the opportunities into simple cohorts, you can now compare the impact of multithreading behaviors on business metrics. Comparing opportunities with high multithreading activities against those with low multithreading helps filter out the noise in the data and reveal the true link between behavior change and business outcomes.
Key metrics:
Example in practice:
A data analytics company's healthcare vertical rolls out an industry learning program. Six months after the roll out, the cohort that consistently involved senior business leaders in their conversations sees a 13% higher average deal size and a 4% higher win rate on opportunities over $500K. Their sales cycles are also about 18 days shorter, suggesting that deeper business engagement accelerates decision-making. In post-deal interviews, customers highlight a clear differentiator: sellers who had completed the industry learning program framed their solutions around reducing readmissions and improving care quality, while others focused on technical features like data infrastructure and system integration.
Example dashboard:
The diagnostic value:
If behavior changes (Part 2) but business impact doesn't materialize, investigate deal qualification and sales process rigor. Are sellers having better conversations but with the wrong prospects? Are they engaging executives but failing to build compelling business cases?
Making It Work: Implementation Essentials
Start with headline metrics, not everything. While the framework includes 15+ metrics, start simple by reporting on just 5-6. Use the rest for diagnostic deep-dives. Key metrics to start with are:
- Training engagement (leading)
- Completion rates
- Learner feedback
- Seller behaviour (translational)
- Business executives met, per opportunity (e.g., multithreading score)
- Business impact (lagging) - measured across multithreading scores
- Win rates
- Deal value
Capture your baseline first. Pull 3-6 months of pre-training data on your key metrics. Segment by seller tenure, geography, and product line so you can make fair comparisons and control for confounding variables when executives question your results.
Build in comparison groups. If politically feasible, stagger your training rollout to create natural control groups. Even comparing early adopters to later cohorts provides credibility.
Set time-bound expectations with leadership. Make it clear that different metrics surface results on different timelines. This prevents premature judgment and avoids unrealistic ROI expectations.
Don't forget the managers. Manager reinforcement is the missing link in most training programs. Track whether managers are incorporating industry frameworks into pipeline reviews and coaching conversations. If managers aren't reinforcing, sellers won't sustain new behaviors.
Invest in data infrastructure early. The single biggest implementation failure point is poor data quality. Audit your CRM contact role fields to ensure it includes business versus technical personas, train your team on proper tagging, and configure your conversation intelligence tools (like Gong or Chorus) before launching the program. Without clean data, you're flying blind.
Engaging Leadership
The power of this framework lies in its narrative logic:
- Engagement builds capability: Sellers complete training, demonstrate knowledge, and gain confidence in industry conversations
- Capability drives behavior change: Sellers engage broader stakeholders, use business-outcome language, and position strategic value instead of technical features
- Behavior change creates business impact: Larger deals, faster cycles, higher win rates, and deeper strategic relationships
When you present this framework to leadership, you're not just reporting numbers—you're telling a story about transformation. And when any tier underperforms, you know exactly where to intervene.
Final Thoughts
Industry learning is not just another training program. It’s a strategic lever that enables sellers to shift conversations from features to business outcomes, from IT backrooms to the boardroom. Yes, measuring it is complex. Yes, it requires creativity. But with the right framework, dashboards, and behavioral signals, you can prove its value and, more importantly, scale it across your sales force.

Frequently Asked Questions
.jpg)
.jpg)


.png)